|
Olympe Engine 2.0
2D Game Engine with ECS Architecture
|
Loading...
Searching...
No Matches
|
Olympe Engine 2.0
2D Game Engine with ECS Architecture
|
Singleton performance profiler for VS graph node execution. More...
#include <PerformanceProfiler.h>
Public Member Functions | |
| void | BeginProfiling () |
| Enables profiling. | |
| void | StopProfiling () |
| Disables profiling and optionally clears accumulated data. | |
| bool | IsProfiling () const |
| Returns true if profiling is currently enabled. | |
| void | BeginFrame () |
| Marks the start of a new frame. | |
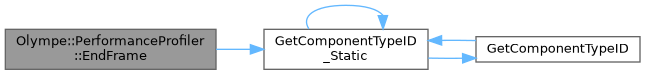
| void | EndFrame () |
| Marks the end of the current frame. | |
| void | BeginNodeExecution (int nodeID, const std::string &nodeName) |
| Records the start time for a node execution. | |
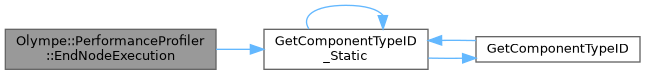
| void | EndNodeExecution (int nodeID) |
| Records the end time for a node execution and updates metrics. | |
| FrameProfile | GetCurrentFrame () const |
| Returns the current (in-progress) frame profile. | |
| std::vector< FrameProfile > | GetFrameHistory (int count=0) const |
Returns up to count most recent completed frame profiles. | |
| std::vector< NodeExecutionMetrics > | GetHotspots () const |
| Returns accumulated lifetime metrics sorted by avgTimeMs descending. | |
| void | Clear () |
| Clears all accumulated data and history. | |
| bool | SaveToFile (const std::string &path) const |
| Exports the frame history to a CSV file. | |
Static Public Member Functions | |
| static PerformanceProfiler & | Get () |
| Returns the singleton instance (Meyers pattern). | |
Static Public Attributes | |
| static const int | MAX_FRAME_HISTORY = 120 |
| Number of frames kept in the rolling history buffer. | |
| static constexpr float | HOTSPOT_THRESHOLD_MS = 1.0f |
| Hotspot threshold (ms) — nodes above this are flagged. | |
Private Member Functions | |
| PerformanceProfiler () | |
| ~PerformanceProfiler () | |
| PerformanceProfiler (const PerformanceProfiler &)=delete | |
| PerformanceProfiler & | operator= (const PerformanceProfiler &)=delete |
Private Attributes | |
| std::mutex | m_mutex |
| bool | m_profiling = false |
| uint64_t | m_frameNumber = 0 |
| std::unordered_map< int, std::chrono::steady_clock::time_point > | m_nodeStartTimes |
| Per-frame timing: node ID -> start time. | |
| std::unordered_map< int, NodeExecutionMetrics > | m_frameNodeMetrics |
| Accumulated per-frame node metrics (reset each BeginFrame) | |
| std::unordered_map< int, NodeExecutionMetrics > | m_lifetimeMetrics |
| Lifetime metrics per node. | |
| std::vector< FrameProfile > | m_frameHistory |
| Rolling frame history buffer. | |
| std::chrono::steady_clock::time_point | m_frameStartTime |
| Frame start time. | |
Singleton performance profiler for VS graph node execution.
Usage pattern (from VSGraphExecutor):
Usage pattern (from TaskSystem / game loop):
Meyers singleton pattern (local static in Get()). Thread-safe via std::mutex.
Definition at line 80 of file PerformanceProfiler.h.
|
private |
Definition at line 28 of file PerformanceProfiler.cpp.
|
private |
Definition at line 32 of file PerformanceProfiler.cpp.
|
privatedelete |
| void Olympe::PerformanceProfiler::BeginFrame | ( | ) |
Marks the start of a new frame.
Clears the per-frame node timing accumulators.
Definition at line 69 of file PerformanceProfiler.cpp.
References GetComponentTypeID_Static(), m_frameNodeMetrics, m_frameNumber, m_frameStartTime, m_mutex, m_nodeStartTimes, and m_profiling.
 Here is the call graph for this function:
Records the start time for a node execution.
| nodeID | ID of the node. |
| nodeName | Human-readable node name (used on first call). |
Definition at line 118 of file PerformanceProfiler.cpp.
References GetComponentTypeID_Static(), m_frameNodeMetrics, m_mutex, m_nodeStartTimes, m_profiling, and Olympe::NodeExecutionMetrics::nodeID.
Here is the call graph for this function:| void Olympe::PerformanceProfiler::BeginProfiling | ( | ) |
Enables profiling.
Must be called before BeginFrame().
Definition at line 40 of file PerformanceProfiler.cpp.
References GetComponentTypeID_Static(), m_frameHistory, m_frameNodeMetrics, m_frameNumber, m_mutex, m_nodeStartTimes, and m_profiling.
Here is the call graph for this function:| void Olympe::PerformanceProfiler::Clear | ( | ) |
Clears all accumulated data and history.
Definition at line 216 of file PerformanceProfiler.cpp.
References GetComponentTypeID_Static(), m_frameHistory, m_frameNodeMetrics, m_frameNumber, m_lifetimeMetrics, m_mutex, and m_nodeStartTimes.
Here is the call graph for this function:| void Olympe::PerformanceProfiler::EndFrame | ( | ) |
Marks the end of the current frame.
Commits the frame data to history.
Definition at line 81 of file PerformanceProfiler.cpp.
References Olympe::FrameProfile::frameNumber, GetComponentTypeID_Static(), m_frameHistory, m_frameNodeMetrics, m_frameNumber, m_frameStartTime, m_mutex, m_profiling, MAX_FRAME_HISTORY, Olympe::FrameProfile::nodeMetrics, and Olympe::FrameProfile::totalFrameTimeMs.
Here is the call graph for this function:Records the end time for a node execution and updates metrics.
| nodeID | ID of the node (must match the last BeginNodeExecution call). |
Definition at line 137 of file PerformanceProfiler.cpp.
References GetComponentTypeID_Static(), m_frameNodeMetrics, m_lifetimeMetrics, m_mutex, m_nodeStartTimes, and m_profiling.
Here is the call graph for this function:
|
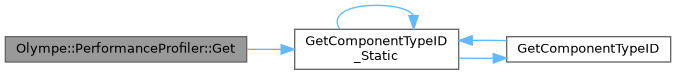
static |
Returns the singleton instance (Meyers pattern).
Definition at line 22 of file PerformanceProfiler.cpp.
References GetComponentTypeID_Static().
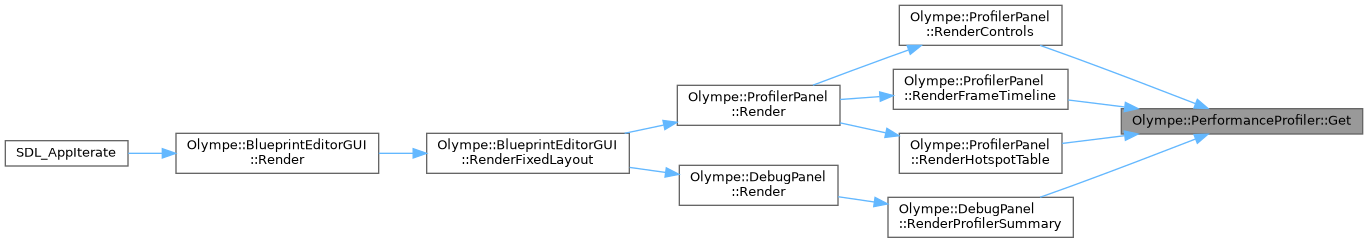
Referenced by Olympe::ProfilerPanel::RenderControls(), Olympe::ProfilerPanel::RenderFrameTimeline(), Olympe::ProfilerPanel::RenderHotspotTable(), and Olympe::DebugPanel::RenderProfilerSummary().
Here is the call graph for this function: Here is the caller graph for this function:| FrameProfile Olympe::PerformanceProfiler::GetCurrentFrame | ( | ) | const |
Returns the current (in-progress) frame profile.
Definition at line 180 of file PerformanceProfiler.cpp.
References Olympe::FrameProfile::frameNumber, GetComponentTypeID_Static(), m_frameNodeMetrics, m_frameNumber, m_mutex, Olympe::FrameProfile::nodeMetrics, and Olympe::FrameProfile::totalFrameTimeMs.
Here is the call graph for this function:| std::vector< FrameProfile > Olympe::PerformanceProfiler::GetFrameHistory | ( | int | count = 0 | ) | const |
Returns up to count most recent completed frame profiles.
| count | Maximum number of frames to return (0 = all). |
Definition at line 191 of file PerformanceProfiler.cpp.
References GetComponentTypeID_Static(), m_frameHistory, and m_mutex.
Here is the call graph for this function:| std::vector< NodeExecutionMetrics > Olympe::PerformanceProfiler::GetHotspots | ( | ) | const |
Returns accumulated lifetime metrics sorted by avgTimeMs descending.
Definition at line 202 of file PerformanceProfiler.cpp.
References GetComponentTypeID_Static(), m_lifetimeMetrics, and m_mutex.
Here is the call graph for this function:| bool Olympe::PerformanceProfiler::IsProfiling | ( | ) | const |
Returns true if profiling is currently enabled.
Definition at line 59 of file PerformanceProfiler.cpp.
References GetComponentTypeID_Static(), m_mutex, and m_profiling.
Here is the call graph for this function:
|
privatedelete |
Exports the frame history to a CSV file.
| path | Destination file path (must be writable). |
Definition at line 226 of file PerformanceProfiler.cpp.
References Olympe::FrameProfile::frameNumber, GetComponentTypeID_Static(), m_frameHistory, m_mutex, Olympe::FrameProfile::nodeMetrics, and Olympe::FrameProfile::totalFrameTimeMs.
Here is the call graph for this function:| void Olympe::PerformanceProfiler::StopProfiling | ( | ) |
Disables profiling and optionally clears accumulated data.
Definition at line 51 of file PerformanceProfiler.cpp.
References GetComponentTypeID_Static(), m_frameNodeMetrics, m_mutex, m_nodeStartTimes, and m_profiling.
Here is the call graph for this function:Hotspot threshold (ms) — nodes above this are flagged.
Definition at line 180 of file PerformanceProfiler.h.
Referenced by Olympe::ProfilerPanel::RenderFrameTimeline(), Olympe::ProfilerPanel::RenderHotspotTable(), and Olympe::DebugPanel::RenderProfilerSummary().
|
private |
Rolling frame history buffer.
Definition at line 210 of file PerformanceProfiler.h.
Referenced by BeginProfiling(), Clear(), EndFrame(), GetFrameHistory(), and SaveToFile().
|
private |
Accumulated per-frame node metrics (reset each BeginFrame)
Definition at line 204 of file PerformanceProfiler.h.
Referenced by BeginFrame(), BeginNodeExecution(), BeginProfiling(), Clear(), EndFrame(), EndNodeExecution(), GetCurrentFrame(), and StopProfiling().
|
private |
Definition at line 198 of file PerformanceProfiler.h.
Referenced by BeginFrame(), BeginProfiling(), Clear(), EndFrame(), and GetCurrentFrame().
|
private |
Frame start time.
Definition at line 213 of file PerformanceProfiler.h.
Referenced by BeginFrame(), and EndFrame().
|
private |
Lifetime metrics per node.
Definition at line 207 of file PerformanceProfiler.h.
Referenced by Clear(), EndNodeExecution(), and GetHotspots().
|
mutableprivate |
Definition at line 195 of file PerformanceProfiler.h.
Referenced by BeginFrame(), BeginNodeExecution(), BeginProfiling(), Clear(), EndFrame(), EndNodeExecution(), GetCurrentFrame(), GetFrameHistory(), GetHotspots(), IsProfiling(), SaveToFile(), and StopProfiling().
|
private |
Per-frame timing: node ID -> start time.
Definition at line 201 of file PerformanceProfiler.h.
Referenced by BeginFrame(), BeginNodeExecution(), BeginProfiling(), Clear(), EndNodeExecution(), and StopProfiling().
Definition at line 197 of file PerformanceProfiler.h.
Referenced by BeginFrame(), BeginNodeExecution(), BeginProfiling(), EndFrame(), EndNodeExecution(), IsProfiling(), and StopProfiling().
Number of frames kept in the rolling history buffer.
Definition at line 177 of file PerformanceProfiler.h.
Referenced by EndFrame().